Main features

Excellent Signal Quality
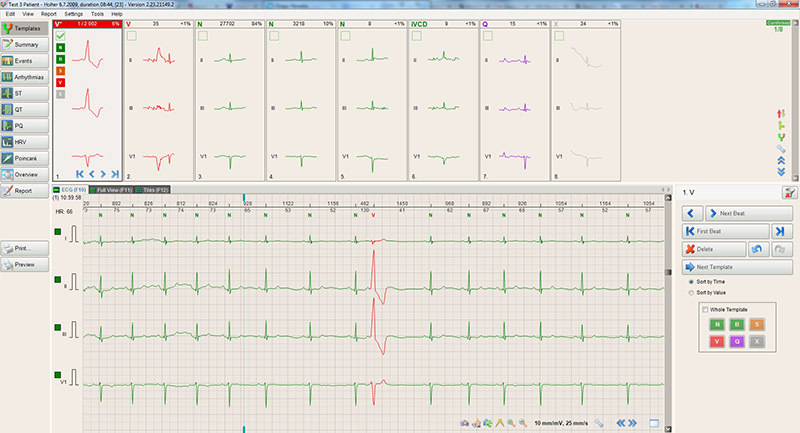
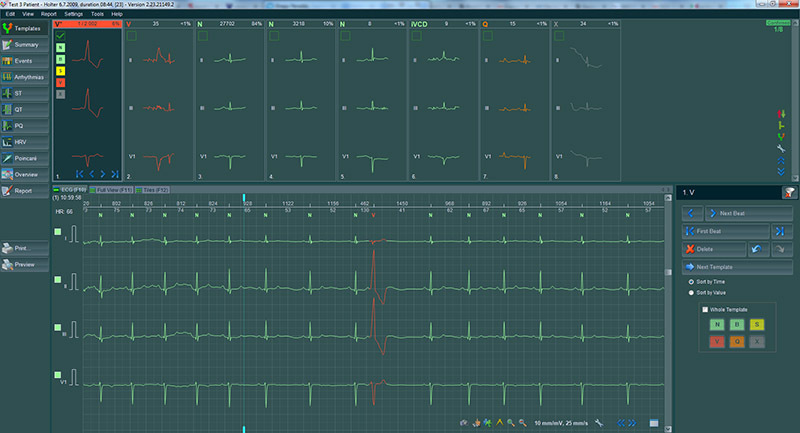
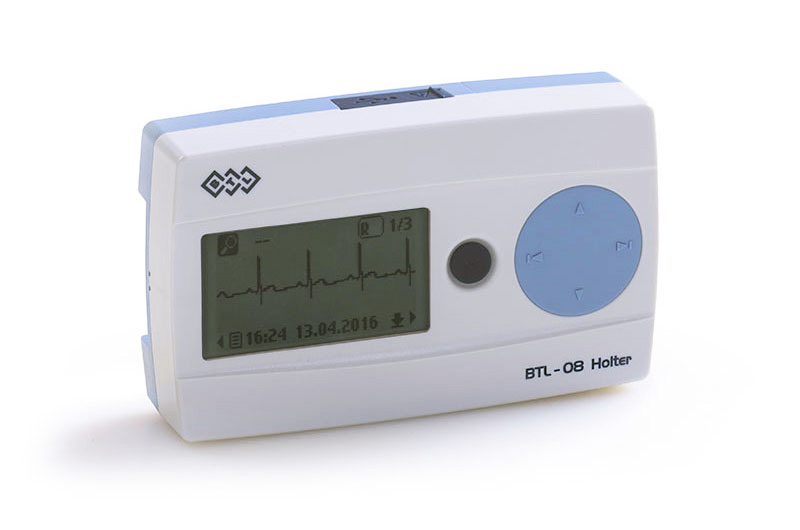
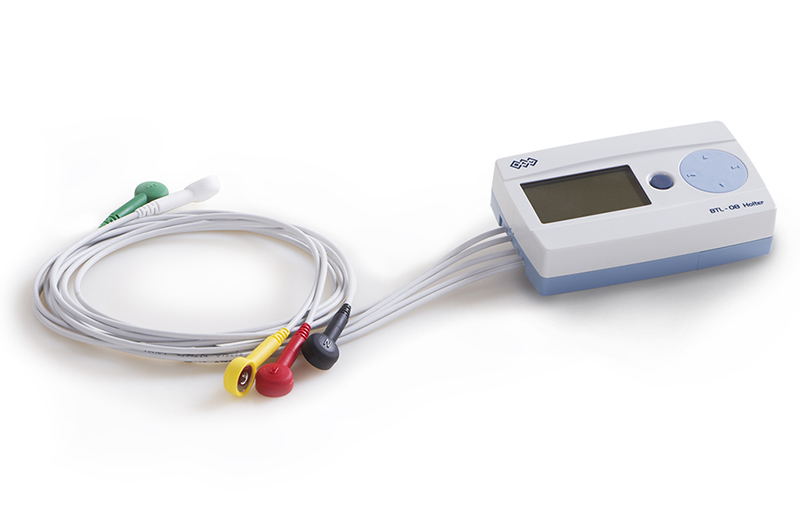
BTL Holter recorder features a supreme signal quality even under highly demanding conditions (e.g. rapid movements). Physicians consequently spend minimum time verifying results of the automatic diagnostics.
BTL CardioPoint®
BTL CardioPoint software is a versatile and complete solution integrating ECG, stress test, Holter, ABPM and spirometry into one unified platform. Its number of possible diagnostic, graphic and network configurations make it a software that adapts to the user rather than the user having to adapt to the software.
Features overview
| H100 | H300 | H600 | |
|---|---|---|---|
| Multilevel templateVarious morphologies are sorted not only into templates but also into "subtemplates" in order to distinguish the fine differences. | Yes | Yes | Yes |
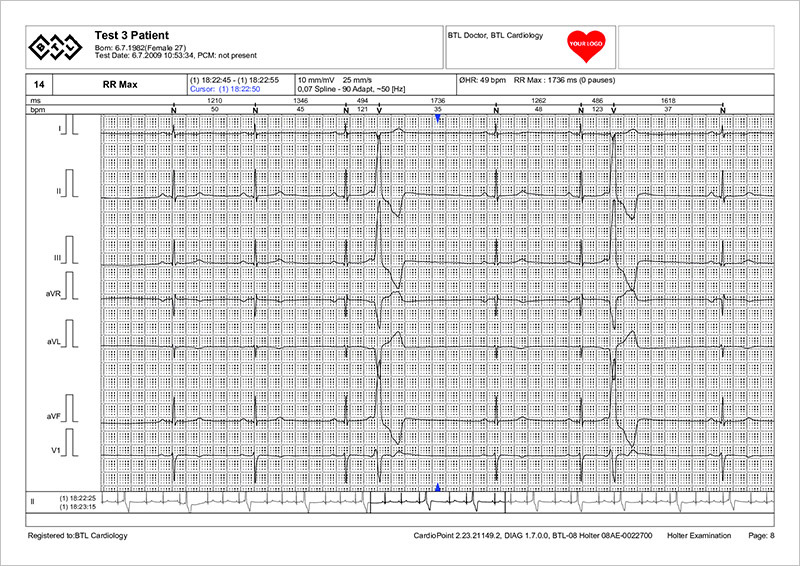
| Rhythm analysisAll the detected rhythms are shown in tables and graphs and sorted based on their importance, duration, heart rate etc. | Yes | Yes | Yes |
| Graphical event splitThis tool helps separate morphologies from one-another quickly. It is useful especially when working with non-homogeneous templates or when eliminating noise. | Yes | ||
| Pacemaker detectionWith the Pacemaker detection all the pacemaker spikes and paced beats are identified in an ECG strip. | Yes | Yes | |
| Pacemaker analysisPacemaker analysis allows verifying the correct function of the pacemaker by detecting the fail-to-sense and the fail-to-capture phenomenons. These phenomenons as well as all the paced beats are shown in well-designed time graphs. | Yes | ||
| HRV tabular evaluationHRV in time and frequency domain is calculated per hour, day or awake/sleep period. The results are shown in a time evalution table. | Yes | Yes | Yes |
| HRV trendsHRV values are plotted against time and can be compared with the heart rate trend or the patient activity graph. | Yes | Yes | |
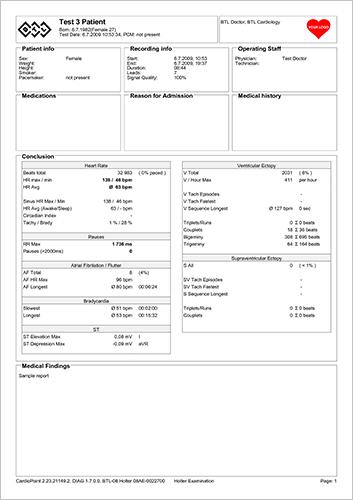
| ST tabular evaluationThis table, also known as the ischemic burden table, shows the maximum, the minimimum and the average level of the ST segment in each lead. It also informs about how often (in %) the ST segment was elevated, depressed or at the baseline. | Yes | Yes | Yes |
| ST trendsST segment is plotted against time. All abnormalities (elevations or depressions) are highlighted. | Yes | Yes | |
| QT, QTc tabular evaluationBoth the QT and the QTc values are displayed in a time evaluation table per hour, day or awake/sleep periods. | Yes | Yes | |
| QT, QTc trendQT and the QTc are plotted against time. All abnormalities (values too high or too low) are highlighted. | Yes | Yes | |
| QT/RR and QT/HR graphsQT(c)/RR and the QT(c)/HR perfectly visualize the dependency of the QT interval on the heart rate. QT should adapt to higher heart rates by becoming shorter. If this in not observed in the graph, the user has the possibility to mark all the suspicious values and verify them in an ECG strip. | Yes | ||
| PQ tabular evaluationPQ values are displayed in a time evaluation table per hour, day or awake/spleep period. | Yes | ||
| PQ trendsPQ is plotted against time. All the abnormalities (values too high or too low) are highlighted. | Yes | ||
| PQ/RR and PQ/HR graphsPQ/RR and the PQ/HR perfectly visualize the dependency of the PQ interval on the heart rate. The PQ should adapt to higher heart rates and become shorter. If this is not observed in the graph, the user has the option to mark all the suspicious values and verify them in an ECG strip. | Yes | ||
| Patient activity monitorBTL Holter records the patient's physical activity. This activity is later plotted against time and can be compared with the heart rate trend or any other graph in the software. | Yes | ||
| WaterfallWaterfall tool displays the heartbeats layered on one-another in a cross-section view so that the result is reminiscent of a waterfall. Using this tool all the irregularities (deformation, redirecting, peak alternation, interval duration change, ectopia, premature beats) can be observed. | Yes | ||
| Relief mapRelief tool gives a completely different look at an ECG signal. Instead of the normal ECG waveform, it displays the data in wavy plane. Aligning the data into this format makes it possible to read information that cannot be read from the classic ECG signal display as easily. The Relief tool displays the cardiac events in a different context and in a broader range than any other classic tool for ECG signal processing and representation. | Yes | ||
| PoincaréPoincaré graph is a special tool allowing the physician to see the complete record at first glance. Although the typical use of this tool is mainly associated with the HRV analysis, its interactivity predisposes this tool for fast search of atrial fibrillation/flutter, extrasystoles, pauses, noisy areas etc. | Yes | ||
| TachogramTachogram plots all the RR values against time. All the abnormalities (values too high or too low) are highlighted. Any suspicious value can be marked and verified in an ECG strip. | Yes | ||
| PSD GraphPSD graph is a tool capable of diagnosing chronic fatigue, sleep disorders or burn-out syndrome. | Yes |